
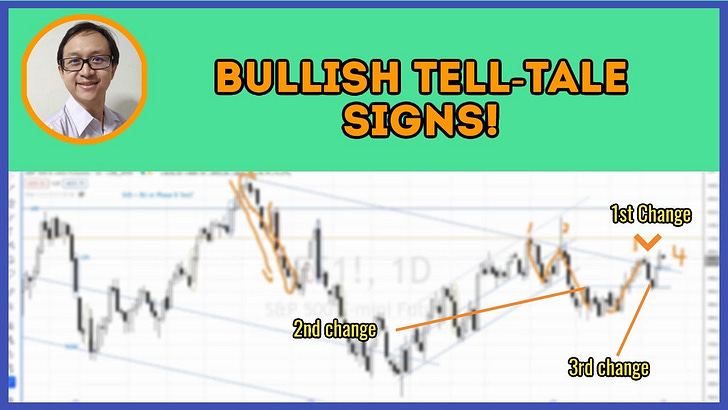

Here are the Bullish Tell-tale Signs Detected in S&P 500 and What to Watch for

The pullback reversal at the axis line in conjunction with Wyckoff’s efforts vs results suggested presence of demand.
Watch the video below to find out how to use the Wyckoff method to detect the bullish subtle changes in S&P 500 and what to expect next for the bullish scenario and when it will be violated.
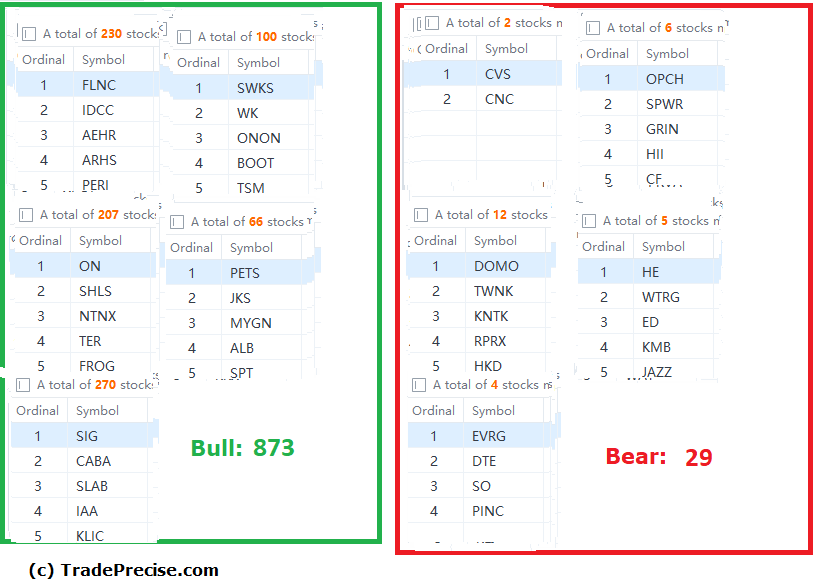
The bullish setup vs. the bearish setup is 873 to 29 from the screenshot of my stock screener below. This is another positive sign, which is inline with the improving market breadth to support the bull case on top of the bullish changes in the price action.
As the S&P 500 attempts to break above the supply line of the down channel, pay attention to the possible reaction as illustrated in the video for the bullish case and where the failure could occur.
The video above is part of the latest Weekly Live Group Coaching Session (1.5 hours). Join here for full discussion including the best trade entry setup every week.
Resources
Subscribe to my YouTube Channel for more free market & stock analysis
Professional free Charting platform: Create an account→ www.TradingView.com
Click here to find out the how to trade or invest to profit from any market consistently without using complex indicators or understanding any financial statement
***********************************************************************************************************
Disclosure: If you click the links in this article and make a purchase or open & deposit the required amount into the recommended broker accounts, we earn a commission at no extra cost to you.
Disclaimer: The information in this presentation is solely for educational purpose and should not be taken as investment advice.