Welcome back :) This free newsletter contains a detailed market analysis video and 3 actionable stock trading ideas. Upgrade to get 25++ stock setups with a trading plan discussed in the paid episode.
This paid episode contains:
The premium video (42:03) focuses on the trade entry setup at the key levels and stop loss for both short-term swing and position trading.
Bonus video (30:00): Detailed analysis on Nasdaq 100, Russell 2000, Dow Jones, crude oil, Gold, Silver, Bitcoin, Copper, Dollar Index.
Market Discussion
Watch the free-preview video above extracted from the WLGC session before the market opens on 17 Jul 2024 to find out the following:
The simplest way to spot a market rotation.
The analogues to adopt to anticipate the market correction
Why the change of character bar on last Thursday signals a shift in the market?
And a lot more...
Market Environment
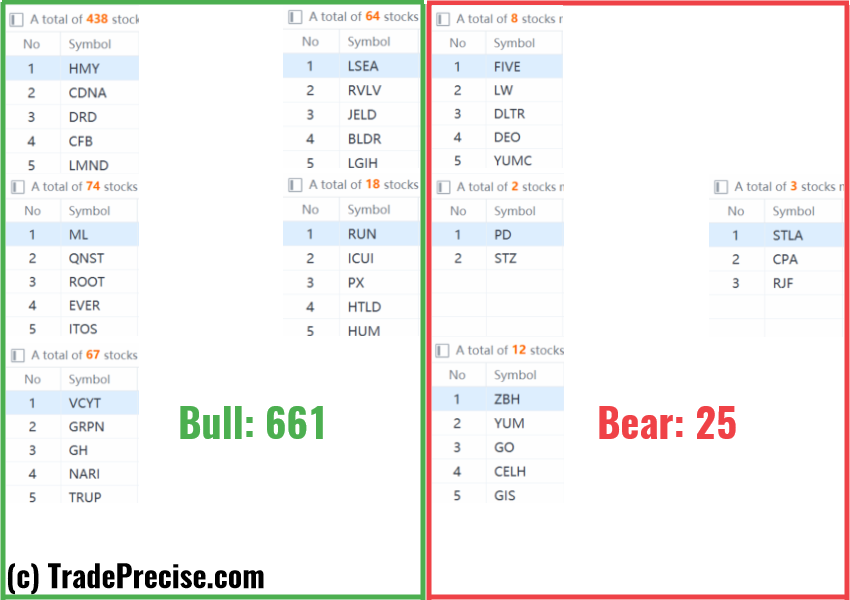
The bullish vs. bearish setup is 661 to 25 from the screenshot of my stock screener below.
There is a clear rotation from Nasdaq 100 and the S&P 500 into the Russell 2000 (& the Dow Jones) since 11 Jul 2024 (Thursday).
This is further confirmed by the significant improvement in both the number of the bullish setups and market breadth.
A pullback or consolidation could provide a great opportunity for re-accumulation. Now again is the best time to identify the next batch of leaders (like KRE 0.00%↑).
3 Stocks Ready To Soar
5 “low-hanging fruits” trade entries setups KD 0.00%↑ TME 0.00%↑ + 19 actionable setups JPM 0.00%↑ were discussed during the live session before the market open (BMO).
Ready to take trading/investing to the next level?
Click here to join me live every Tuesday so you will get 25++ (and more) actionable stock in a video with entries trigger and stop loss (so that you can calculate the position size), special topics (trading/investing), trade reviews, and get your stock analyzed and questions answered, at a fraction of your stop loss per trade.
Click here to achieve consistent success in any market without complex indicators or confusing financial statements.
Subscribe to my YouTube Channel for more free market & stock analysis
Professional free Charting platform: Create an account→ www.TradingView.com
***********************************************************************************************************
Disclosure: If you click the links in this article and make a purchase or open & deposit the required amount into the recommended broker accounts, we earn a commission at no extra cost to you.
Disclaimer: The information in this presentation is solely for educational purposes and should not be taken as investment advice.


