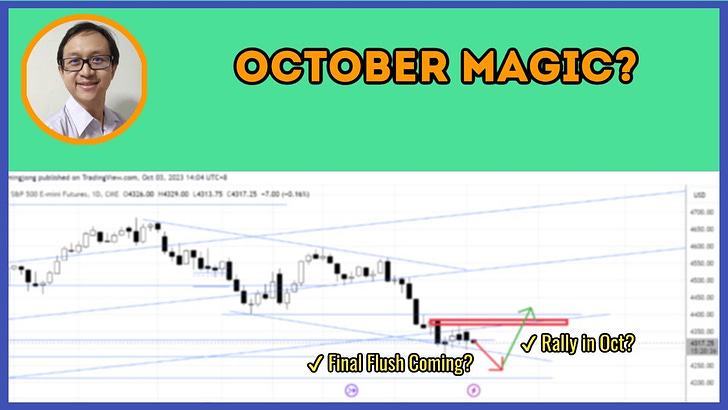
🎯 October's Sneaky Dance: Unmasking the Game-Changer in Price Action and Seasonality
Watch the video extracted from the WLGC session on 3 Oct 2023 below to find out the following:
How to use the up wave and down wave to judge the trend of S&P 500
How to form a directional bias with price action in conjunction with the October's seasonality?
How to interpret the downward momentum with the price action?
What key level should investors pay attention to in order to gauge the S&P 500 direction
And a lot more
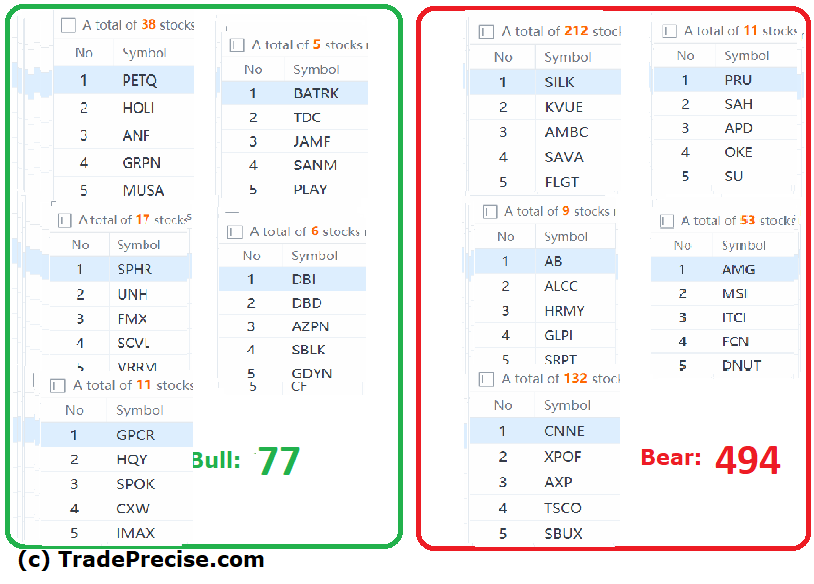
The bullish vs. bearish setup is 77 to 494 from the screenshot of my stock screener below pointing to a very negative market environment.
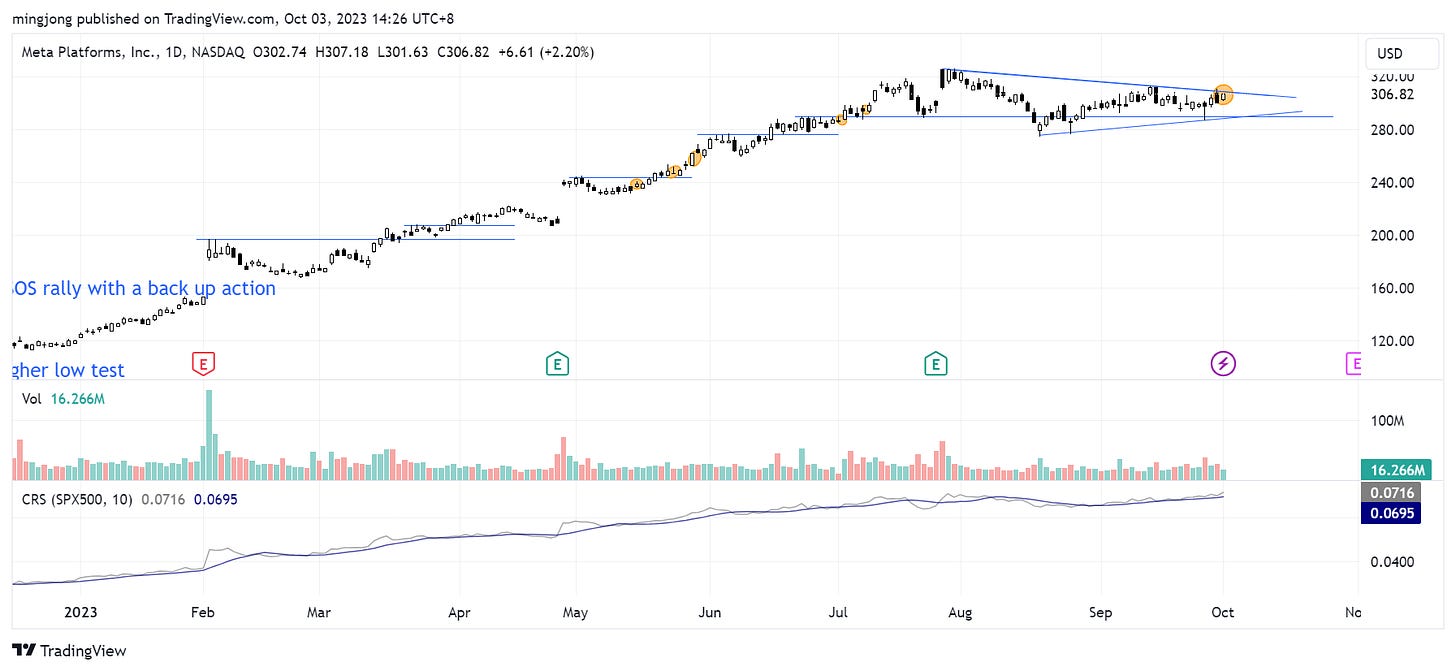
5 “low hanging fruits” (META, AKAM, etc…) trade entries setup + 18 others (EDU, COUR, etc…) plus 25 “wait and hold” candidates are discussed in the video (31:37) accessed by subscribing members below.
Below the paywall is:
The premium video (31:37) focuses on the trade entry setup at the key levels and stop loss for both short-term swing and position trading.
Let me know what you think.
Like what you see so far?
Click here to join me live every Tuesday so you will get 25++ (and more) actionable stock in a video with entries trigger and stop los (so that you can calculate the position size), special topics (trading/investing), trade reviews, and get your stock analyzed and questions answered, at a fraction of your stop loss per trade.
Click here to find out how to trade or invest to experience a new level of results from any market consistently without using complex indicators or understanding any financial statement


