Watch the video extracted from the live session on 5 Sep 2023 below to find out the following:
How to spot the hidden supply using Wyckoff's Efforts vs. Results.
How to interpret the market structure
Scenarios analysis based on the key levels of the S&P 500
Will the head and shoulder pattern shake the market?
And a lot more
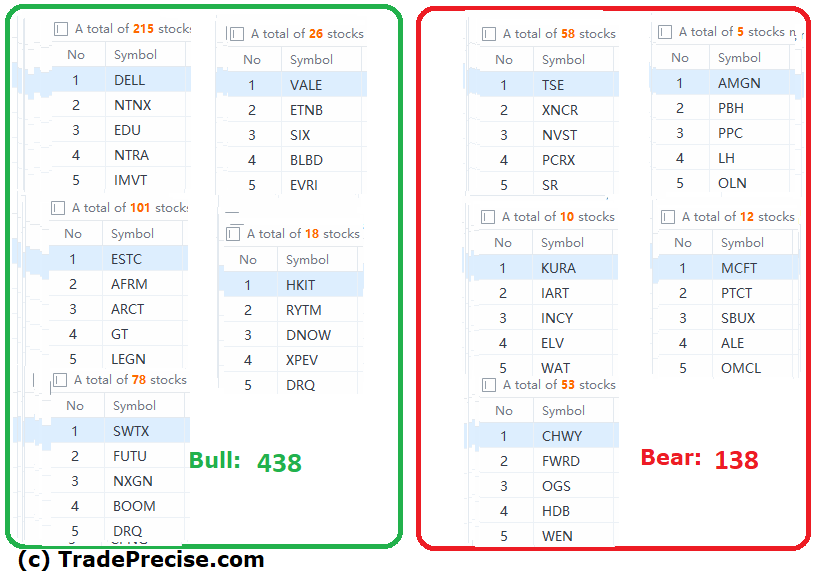
The bullish vs. bearish setup is 438 to 138 from the screenshot of my stock screener below pointing to a positive market environment.
12 “low hanging fruits” (PSX, FTI, etc…) trade entries setup + 33 others (EDU, SLB, etc…) plus 7 “wait and hold” candidates are discussed in the video (51:07) accessed by subscribing members below.
Oil and gas (O&G) stocks have been outperforming for more than a month. The successful backup in the crude oil accumulation structure last week will act as a tailwind for the O&G stocks.
Below the paywall is the premium video (51:07) focusing on the trade entry setup at the key levels and stop loss for both short-term swing and position trading.
Like what you see so far?
Click here to join me live every Tuesday so you will get 25++ (and more) actionable stock in a video with entries trigger and stop loss (so that you can calculate the position size), special topics (trading/investing), trade reviews, and get your stock analyzed and questions answered.
Click here to find out how to trade or invest to experience a new level of results from any market consistently without using complex indicators or understanding any financial statement


